Instrumentation
To analyze the bottlenecks and to optimize the performance of BBoxDB, the software maintains some performance counter. The counter contains information about the unflushed memtables, read and written bytes to disk or network connections.
Enabling performance counter in BBoxDB
First of all, to work with performance counter, these counter needs to be enabled in BBoxDB. The performance counter is published via HTTP on a specific port. The port is controlled via the performanceCounterPort variable in the bboxdb.yaml` configuration file. The default setting is port 10085; a value of -1 disables the HTTP service.
After the server was activated, you can open the URL http://node-ip:10085/ in your browser. A text page with some counter should be displayed. You will find counter such as bboxdb_read_tuples_bytes or bboxdb_read_tuple_keys_total on the page.
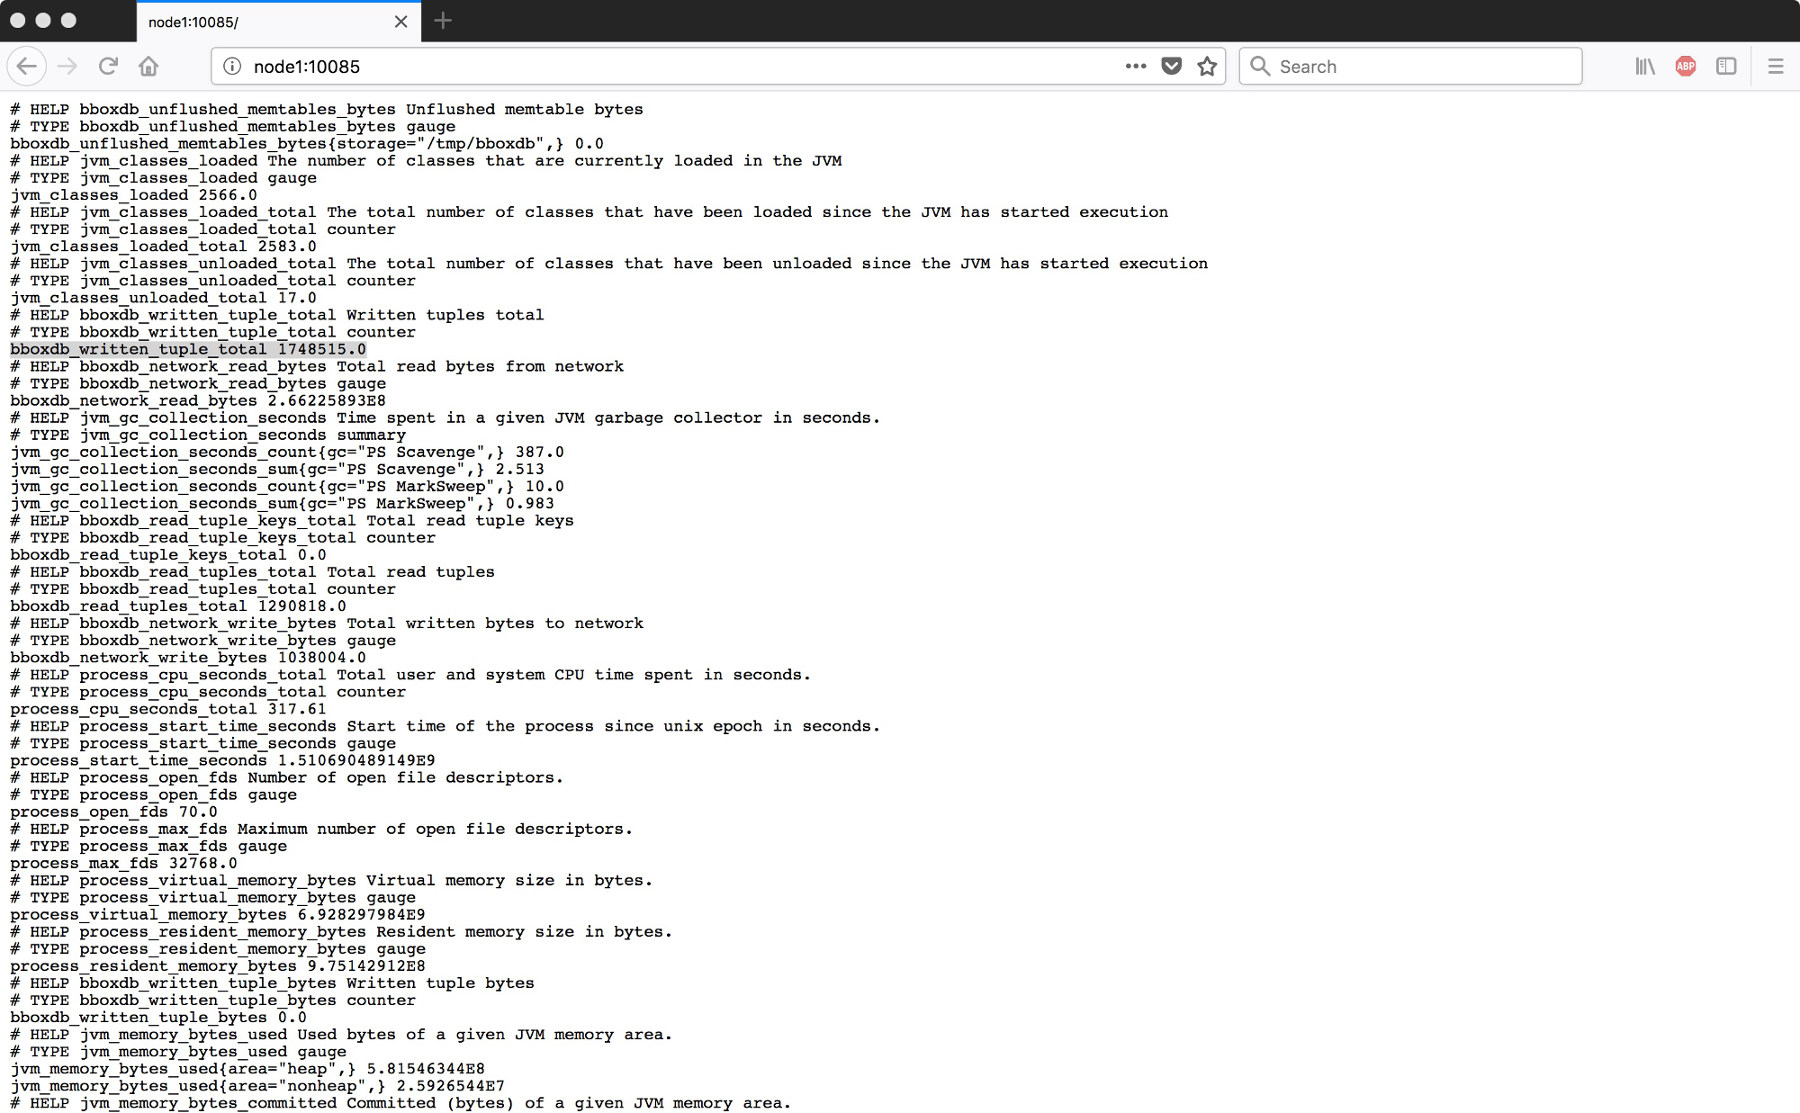
All BBoxDB related counters are starting with the prefix bboxdb_. Also, details about the JVM are shown. The following performance counters are implemented at the moment:
| Name | Dimension | Description |
|---|---|---|
bboxdb_network_read_bytes |
Bytes | The amount of read bytes from the network connection |
bboxdb_network_write_bytes |
Bytes | The amount of written bytes from the network connection |
bboxdb_network_read_packets_total |
Packets | The amount of read network packets |
bboxdb_network_read_insert_packets_total |
Packets | The amount of processed insert calls |
bboxdb_network_connections_total |
Connections | The amount of active client connections to the instance |
bboxdb_read_tuple_keys_total |
Keys | The amount of read keys from SSTables |
bboxdb_read_tuple_total |
Tuples | The amount of read tuples from SSTables |
bboxdb_read_tuple_bytes |
Bytes | The amount of bytes caused by tuple load operations |
bboxdb_written_tuple_total |
Tuples | The amount of written tuples to disk |
bboxdb_written_tuple_bytes |
Bytes | The amount of bytes caused by tuple write operations |
bboxdb_unflushed_memtables_total |
Memtables | The amount of unflushed memtables (grouped by disk storage) |
bboxdb_unflushed_memtables_bytes |
Bytes | The amount of bytes allocated by unflushed memtables |
bboxdb_request_get_latency_seconds |
Seconds | The latency time of get() operations (across memtables and SSTables) |
bboxdb_network_tuple_locks_total |
Locks | The amount of active tuple locks |
Capture the performance counter with Prometheus
Prometheus is used as the data store for the performance counter. To work with the software, download and unpack it into a certain directory.
wget https://github.com/prometheus/prometheus/releases/download/v2.14.0/prometheus-2.14.0.linux-amd64.tar.gz
tar zxvf prometheus-2.14.0.linux-amd64.tar.gz
cd prometheus-2.14.0.linux-amd64/
Then create a config file prometheus.yml which contains a job for all of your BBoxDB instances. In our configuration file, the data is read from the systems node1 and node2 from the port 10085.
# my global config
global:
  scrape_interval:     15s # Set the scrape interval to every 15 seconds. Default is every 1 minute.
  evaluation_interval: 15s # Evaluate rules every 15 seconds. The default is every 1 minute.
  # scrape_timeout is set to the global default (10s).

# Alertmanager configuration
alerting:
  alertmanagers:
  - static_configs:
    - targets:
      # - alertmanager:9093

# Load rules once and periodically evaluate them according to the global 'evaluation_interval'.
rule_files:
  # - "first_rules.yml"
  # - "second_rules.yml"

# A scrape configuration containing exactly one endpoint to scrape:
# Here it's Prometheus itself.
scrape_configs:

  - job_name: 'BBoxDB1'
    scrape_interval:     5s
    static_configs:
      - targets: ['node1:10085', 'node2:10085']
        labels:
          group: 'BBoxDB-Cluster1'
After the configuration file is created, start Prometheus with the following command.
./prometheus --config.file=prometheus.yml
Now you can open the URL http://your-node:9090 and see on the page Status -> Targets whether the data can be read by all nodes or not.
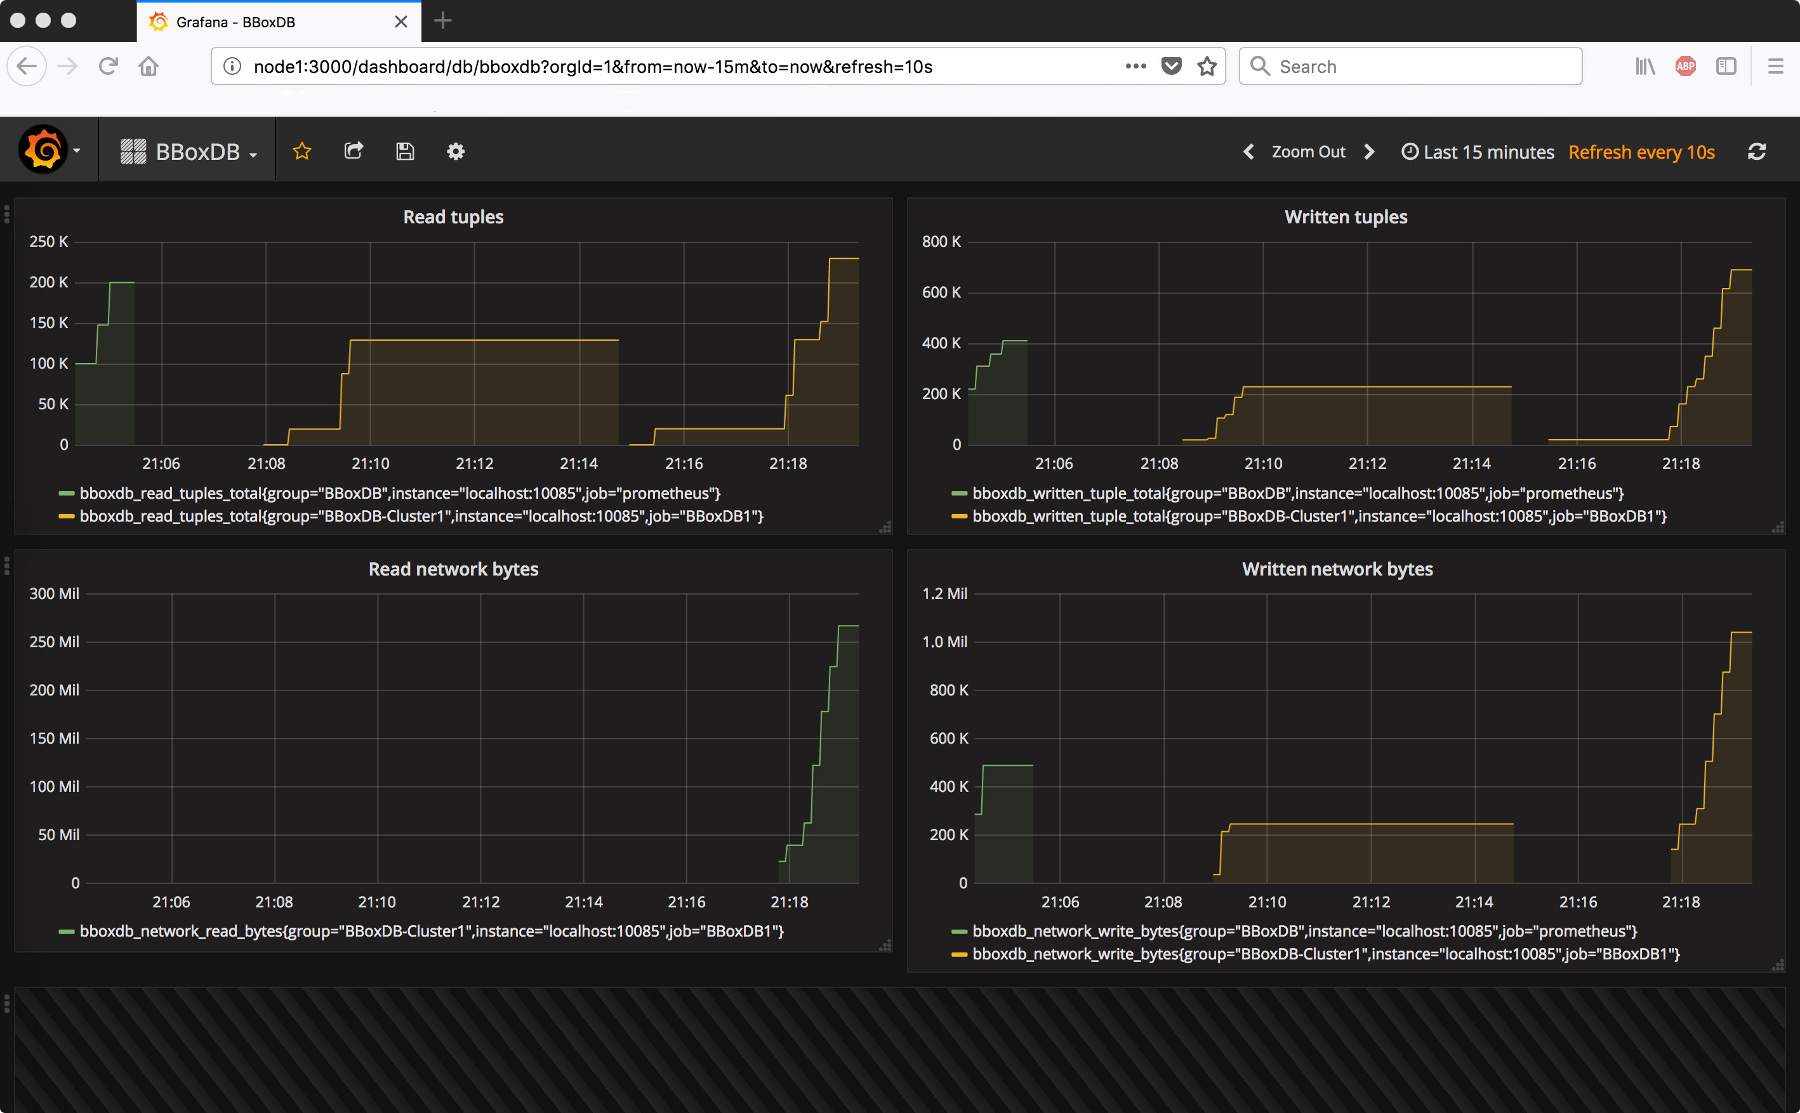
Visualize the data with Grafana
Grafana is widely used for the virtualization of time series. Also, Grafana allows querying Prometheus as a data source. The installation is quite easy; the software needs to be downloaded, unpacked and started. The configuration is done via the web interface.
wget https://dl.grafana.com/oss/release/grafana-6.5.1.linux-amd64.tar.gz
tar -zxvf grafana-6.5.1.linux-amd64.tar.gz
cd grafana-6.5.1/bin
./grafana-server
After adding the Prometheus server, the BBoxDB performance counter could be printed on a dashboard. The virtualization will look like the following screenshot: